Part-time Staff
When we look at part-time staff we will always track changes with an eye on the covariations in full-time staffing. We will do this in three ways. First, we will analyze how the combined full-time/part-time staffing complements for congregations have changed from 2003 to 2009. Second, we will group congregations into one of three fulltime staffing change categories (reduced full-time staff, no change in full-time staff, and added full-time staff) and look more closely at how their part-time staffing complement changed over the same period. Finally, we will look at how part-time staffing complements have changed according to full-time staffing categories in 2003.
Distribution of Part-time Staffing Complements in 2003 and 2009:
Charts 11 and 12 show that
regardless of setting (urban or rural) or year (2003 or 2009), congregations with smaller full-time staffing complements were less likely to have part-time staff. There are two rural full-time categories, however, that need further comment. First, there was an apparent rise in the likelihood that rural congregations with four full-time staff did not have part-time staff (see chart 12). The difference was modest enough and the number of observations were small enough (12) that this should not be regarded as a true deviation from the general trend seen in the chart. Second, rural congregations with no full-time staff in 2003 were more likely to have part-time staff than those with 1 full-time staff, breaking with our general trends. Here again the variance is modest (although the number of observations is sufficient) and the general observation is still useful for understanding how likely it is that a congregation in a particular staffing category was to have part-time staff in comparison with congregations in other full-time staffing categories.
Chart 11 (Below). Percentage distribution of urban part-time (PT) staffing complements by full-time (FT) staffing complements, 2003 and 2009
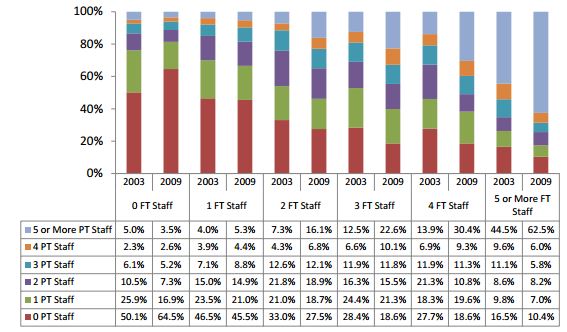
Chart 12. Percentage distribution of rural part-time (PT) staffing complements by full-time (FT) staffing complements, 2003 and 2009
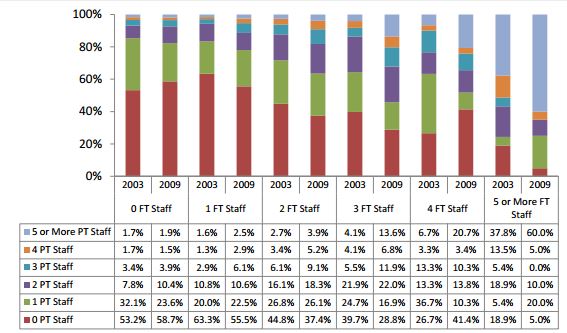
Caution: There were very few observations for 4 and 5 or more full-time staffing categories. See chart 14.
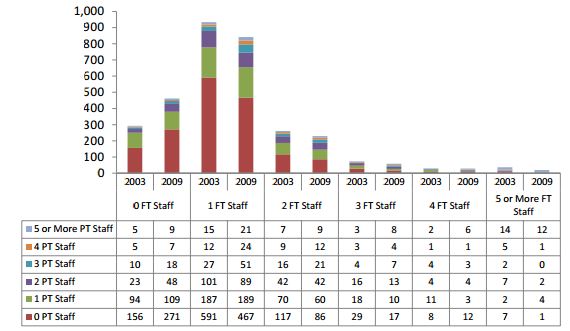
Charts 13 and 14 show that
most congregations without part-time staff were in the zero and 1 full-time staffing categories. In 2009, 76.4% of urban and 86.4% of rural congregations without full-time staff were in the zero and 1 full-time staffing categories, up from 64.7% and 82.3% respectively in 2003.
Chart 13. Urban part-time (PT) staffing complements by full-time (FT) staffing complements, 2003 and 2009
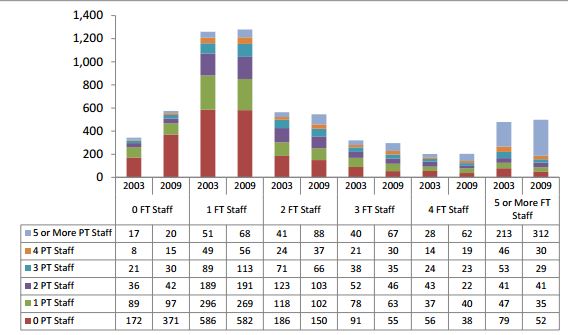
Chart 14. Rural part-time (PT) staffing complements by full-time (FT) staffing complements, 2003 and 2009
 The percentage of congregations that reported neither full- nor part-time staff is growing.
 In 2003, 5.4% of urban congregations and 9.6% of rural ones reported zero staff. By 2009 these numbers had risen to 10.9% and 16.5% respectively.
Part-time Staffing Additions and Reductions, 2003 to 2009
While full-time staffing levels were decreasing, part-time staff levels were increasing. There were 3.1 percentage points more urban congregations reporting reductions than additions in full-time staff between 2003 and 2009; however, for part-time staff 15.0 percentage points more urban congregations reported additions than reductions (see table 1). The trend was broadly similar among rural congregations, with 13.2 percentage points more reductions than additions in full-time staffing complements and 8.2 percentage points more additions than reductions in part-time staffing (see table 2).
Table 1. Percentage of urban congregations reporting changes in full-time and part-time staffing levels between 2003 and 2009a

Table 2. Percentage of rural congregations reporting changes in full-time and part-time staffing levels between 2003 and 2009a

Interestingly, for both urban and rural settings, it was the congregations who either reduced or maintained their full-time staffing complements that were more likely to increase their part-time staffing complements. In the cases where full-time staff complements were reduced and part-time staff were added, it is likely that full-time positions were being replaced by part-time ones. This does not necessarily mean that part-time staff would be stepping into the identical positions that were being vacated by full-time staff. When there are changes in congregational staffing there are often changes in a congregation’s ministry foci. Staffing changes will often result in a realignment of ministry responsibilities for some or all of a congregation’s staff.
While the percentage of urban congregations that reduced both full- and part-time staffing complements was slightly higher than rural ones, 6.4% versus 5.9%, if we conversely look at the percentage of congregations that were growing in both full- and part-time staffing complements, urban congregations clearly have the advantage. Between 2003 and 2009, 10.4% of urban congregations added both full- and part-time staff versus just 4.0% of rural ones.
Congregations, both urban and rural, were more likely to add part-time staff than to reduce them with two exceptions (see charts 15 and 16). First, congregations with zero full-time staff in 2003 were more likely to reduce their part-time staff than to add part-time. Where the congregations from the category with zero full-time staff in 2003 made full-time staffing additions between 2003 and 2009 and they made changes to their part-time staffing complements, they were four times as likely to make part-time staffing reductions as additions. This suggests that when these congregations with zero full-time staff in 2003 were adding full-time staff they were upgrading a parttime position. Second, rural congregations that had very large full-time staffing complements in 2003 (5 or more) were more likely to make part-time staffing reductions than additions. These congregations were also more likely to make full-time reductions and it suggests that the period from 2003 to 2009 was very difficult for rural congregations that started out with large staffing complements in 2003.
Chart 15. Urban congregations that made additions and reductions to their part-time staffing complements between 2003 and 2009 as a percentage of their full-time staffing category in 2003
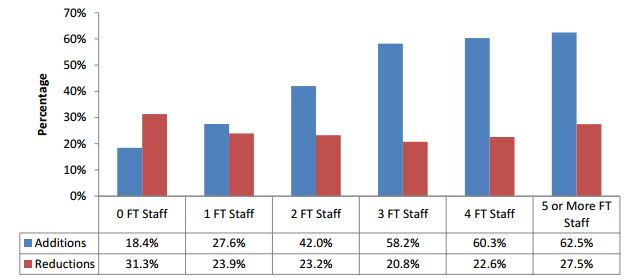
Chart 16. Rural congregations that made additions and reductions to their part-time staffing complements between 2003 and 2009 as a percentage of their full-time staffing category in 2003
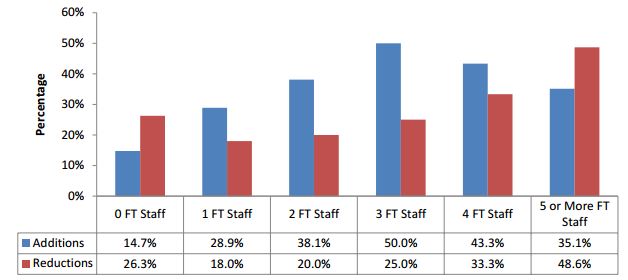
Caution: There were very few observations for 4, and 5 or more full-time staffing categories.
Overall, between 2003 and 2009, 24.7% of urban congregations reduced their part-time staffing complements while 39.7% of congregations increased them; the numbers for rural congregations were 21.1% and 29.3% respectively. In both urban and rural congregations, however, the increase in part-time staff was greatest among those congregations that reduced their full-time staff.
Of the congregations that reported a reduction in full-time staff, urban congregations reported making additions to part-time staff over reductions by a ratio of 2.4 to 1, while rural congregations showed the same trend at a ratio of 1.9 to 1.
Of the congregations that reduced full-time staffing complements between 2003 and 2009, 44.6% of urban congregations and 37.0% of rural ones added the same number or more part-time staffing positions.
How significant is this conversion? If we look at the opposite trend (congregations that appear to be converting part-time positions into full-time ones) we find that between 2003 and 2009, of the congregations that increased their full-time staffing complements, 25.1% of urban congregations and 40.0% of rural ones reduced their parttime staffing complements by an equal or greater number of positions.
Put another way, if we consider all congregations and not just those which made reductions in full-time staff between 2003 and 2009, 12.9% of urban congregations and 10.2% of rural ones appear to have converted fulltime positions into one or more part-time positions between 2003 and 2009. Going the opposite direction, congregations that appear to be converting part-time positions to full-time ones, there we found only 6.4% of urban and 4.6% of rural congregations. So, on the whole, it would appear
that full-time positions were being converted to part-time ones at roughly twice the rate that part-time positions were being converted into fulltime ones. The net percentage of full- to part-time converting congregations over part-time to full-time converting congregations was 6.5% of urban congregations and 5.6% of rural ones. This seems modest, until we consider the short time period over which we observed this change – just 6 years.
The larger the urban full-time staffing complement in 2003, the more likely a congregation was to have made additions to its part-time staffing complements by 2009 (see chart 15). Rural congregations on the other hand apparently have found it increasingly difficult to add part-time staff in the higher full-time staffing categories in 2003 (see chart 16).13 Examining the same full-time staffing categories in 2003 for reductions in part-time staff, we see different trends. The percentage of urban congregations reporting reductions is reasonably flat across all fulltime categories in 2003, meaning that an urban congregation’s full-time staffing category does not appear to influence the likelihood that it would reduce part-time staff. Rural congregations with larger full-time staffing complements in 2003, on the other hand, appear more likely to reduce part-time staff than those with smaller fulltime staffing complements.